








The tenth week of Mythic+ this season is over, and Nightstalker314 is reviewing the weekly data from Raider.IO. The Venomstone upgrades brought back the kind of upgrades we knew from season 1. The increased grind, combined with fewer ilvl benefits, drove up M+ metrics but felt worse this time around. 13.35% more runs are a major upswing this late into the season. But they also seem like a last uproar before the start of WoW Forever. So, let’s look at the details.
Weekly Total Run Performance Compared To Other Seasons
The regional values differ quite a lot from the global increase of 13.35%. CN (9.13%) is far below the rest, which is due to higher activity in general. Or they leaned more heavily into alternative sources like heroic raiding or delves. KR (14.46%) and the US (14.65%) were close to the average. EU (18.99%) once again lived up to its min/maxing reputation. And TW (26.19%) was the biggest outlier. But players pivoting hard in smaller regional populations can shift the numbers that much.
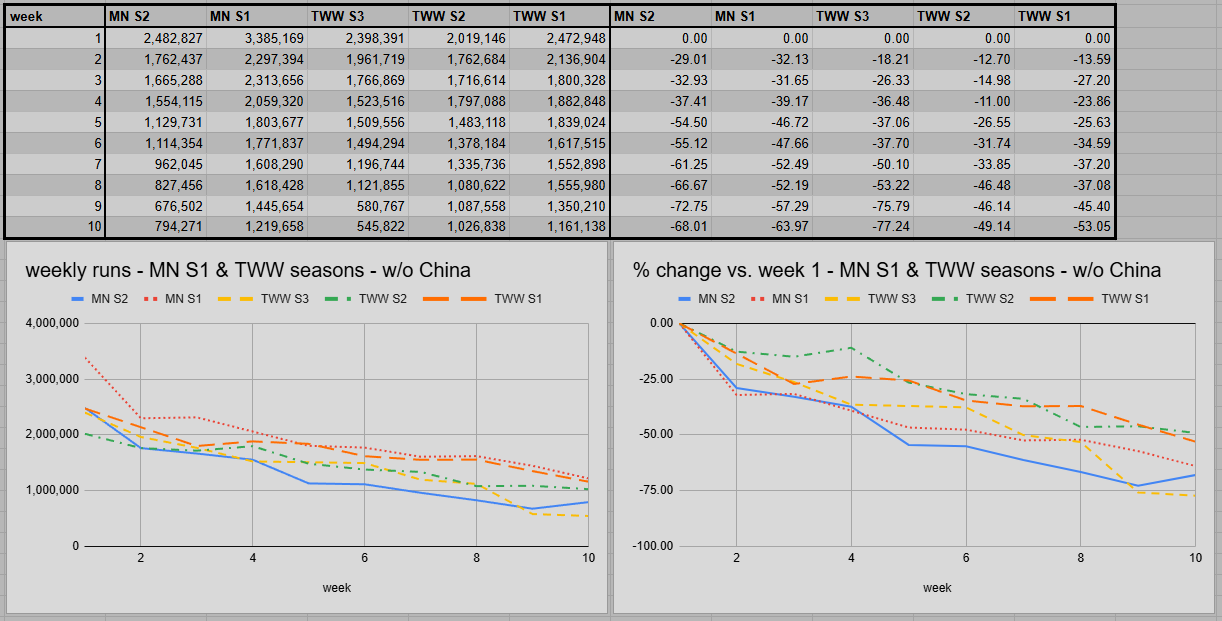
This week had the biggest gain in a mid-season week for several seasons. The last time we saw such a course correction was the Turbo Boost even in TWW S2. When players could upgrade every single item twice, not just 4 slots. While this looks a bit better for now, the follow-up week has a redirecting drop before the WoW Forever launch. That one could lead to a drop between 30% and 50%. But that is still a few days away.
Difference in Venomstone Efficiency and Activity Fluctuation
Venomstones, as the themed replacements for Voidcores, are received worse this time around. The item level increase is just a +7 instead of +9. And you have to combine 10 instead of 5 fragments. Calculated per item level, this was an increase of 157% in terms of grind effort. In comparison, gearing in MN S1 was rather easy, especially in M+ due to twice the amount of bonus rolls. Players see these changes in 12.1 as a massive overcorrection. And just because the numbers show that players will participate doesn’t mean that they enjoy it as much.
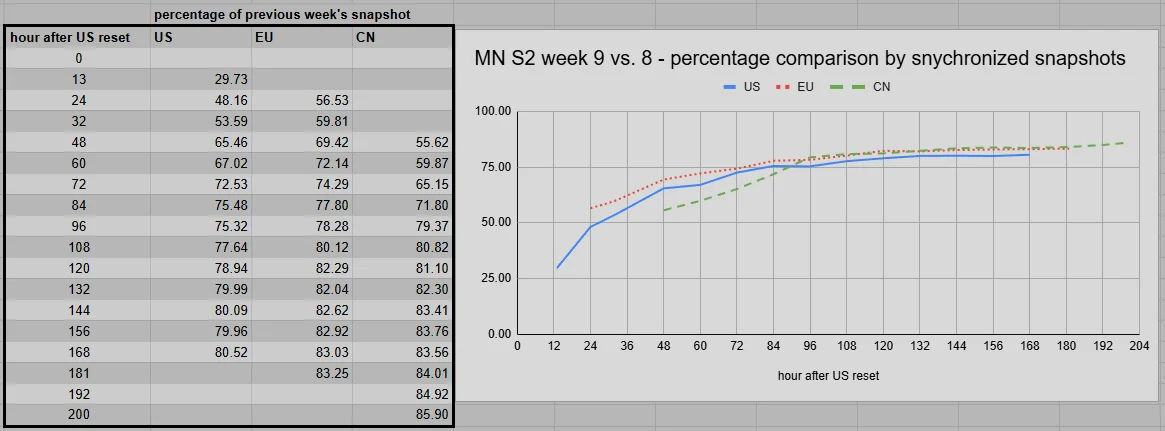
Looking at the synchronized snapshots for the three major regions from week to week, we can see massive shifts in activity over the course of these IDs. Influenced by new and competing features as well as Patch maintenance. Week 9 (Patch 12.1.5 release) started massively behind the curve of the previous week. It only stabilized within the second half. Extended maintenance in all regions, as well as chasing the Labyrinth title for the first two to three days.
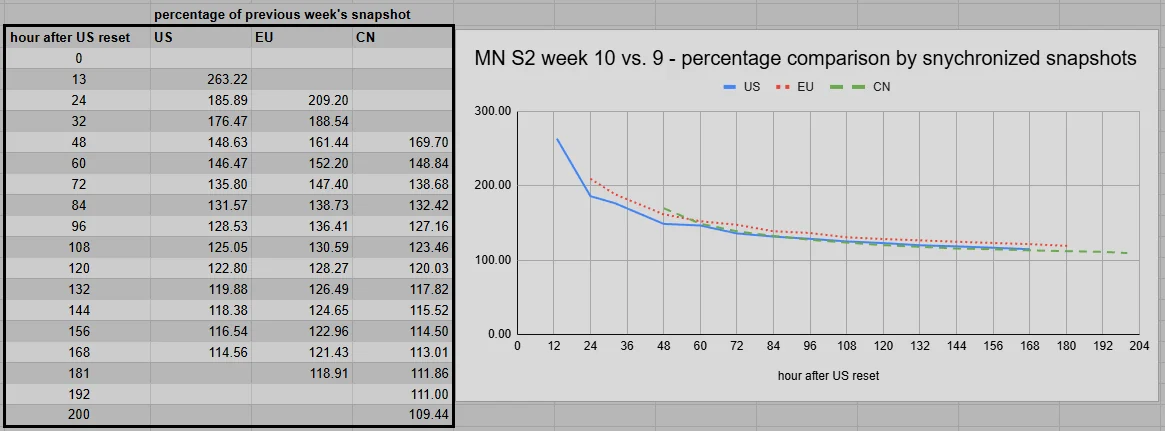
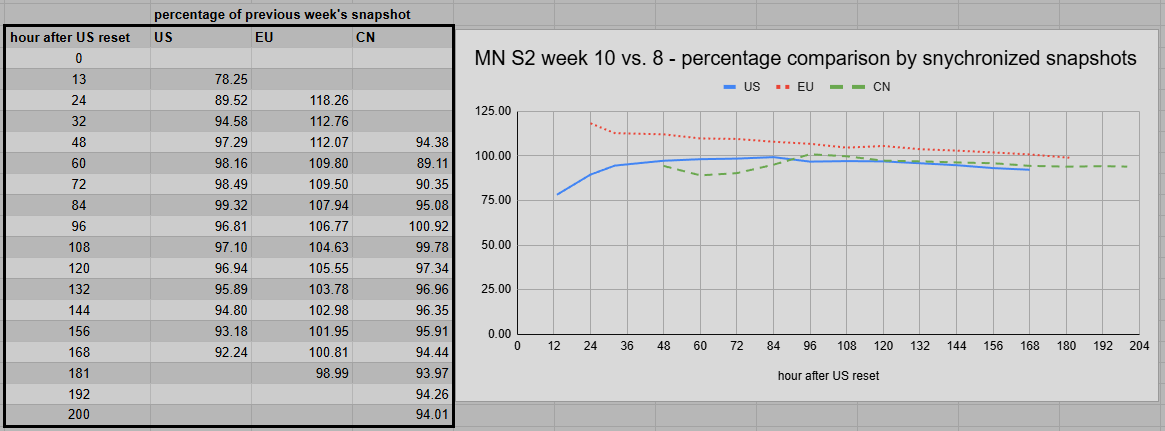
Week 10 was the exact opposite. A complete focus on getting at least 1 or 2 items upgraded. The heroic raid for 8 stones and 4 daily bountiful give limited rewards. So this only leaves M+ spamming as the viable alternative. When looking at the upgrade vs. pre-patch week (10 vs. 8), the picture shifts. EU players have a stronger focus on M+ in general and only doubled down with the Venomstone release.
Total Runs Across All Dungeons
The gap from most to least favorite dungeon decreased once again from 3.94 points to 3.23 points. Major nerfs from the previous week, as well as speed-running +10s, boosted the overall success rate by 1.55 percentage points. The order of dungeons did not change at all. Blinding Vale at least caught up to the rest again, and the farm dungeons for BIS items continued losing relevance.
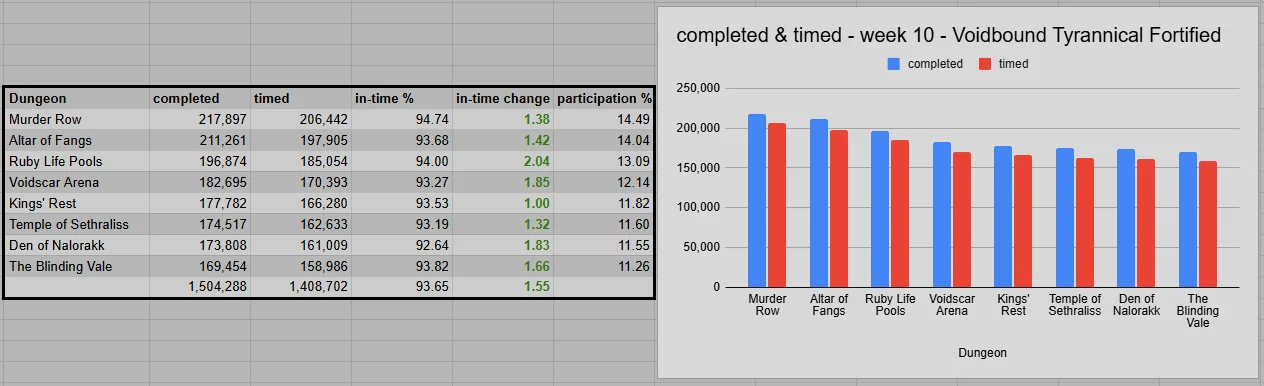
Murder Row (94.74%) has been the easiest dungeon since day 1 with a comfortable lead. Ruby Life Pools (94.00%) started the season with major tuning issues, just like the Blinding Vale (93.82%) and Altar of Fangs (93.68%). Kings’ Rest (93.53%), Voidscar Arena (93.27%), and Temple of Sethraliss (93.19%) used to be within the top half. But proper dungeon tuning, even 10 weeks later, can do wonders. Den of Nalorakk (92.64%) kept its last spot but was only 2.10 percentage points behind Murder Row compared to a staggering 6.68 points in week 1.
Split Across All Key Levels
91.77% of all keys were completed at key level 10 or higher. With that, MN S2 outpaced MN S1 in week 10 (89.05%). But at that time, we had another dungeon event week, boosting lower key-level numbers. Overall, +12 (26.36%) did see more runs than +10 (26.07%), but that also depended on the region. China (21.30% and 29.97%) had almost the inverse values of the other regions (30.33% and 23.13%). In absolute numbers, +10 (+46.93%) and +12 (+20.22%) gained, while all levels up to +18 saw lower values. Compared to last week and week 10 of MN S1, all key levels from +19 upward saw growth in absolute numbers and relative share. The focus on +18 for Keystone Myth has become visible; at 5.09%, it was the 3rd most popular key level behind +12 and +10.
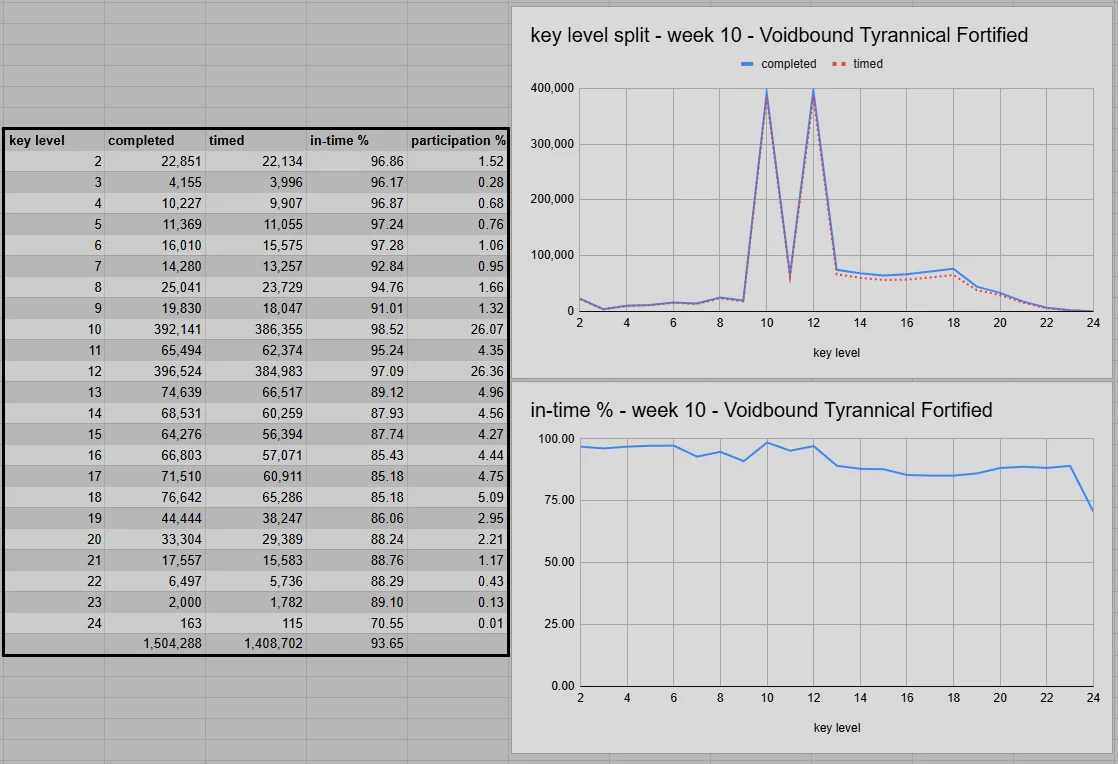
The overall success rate improved by 1.55 percentage points from 92.10% to 93.65%. While a change in affixes led to a minor drop-off of less than 0.7 points from key level 5 to 9, improvements from 1.02 to 1.58 for key level 10 to 13 had the biggest impact on the overall average. Those key levels represented 61.74% of all runs. At 98.52%, +10 was dominated by fast clear runs way below 20 minutes for Venomstones. During the first few days, the regional value for China even made it past 99%. And these values have not been beaten by any week in MN S1. Though once the grind focus is over, the averages will drop again.
Conclusion and Week 11 Forecast
Higher engagement might look good on paper. With 12.2, the devs really have to find a healthy middle ground for rewards and incentives. Raiding and M+ should stand on their own two feet instead of being overrun or abandoned because one offers way more than the other. Deterministic gearing with 1-2 bonus rolls on guaranteed BIS each week is a double-edged sword. It also means that players not only can achieve a BIS item lineup in less than half the duration of a season, but they might also get used to expecting it.
As of this writing, 144 hours after the US reset, the hourly numbers for all major regions have corrected in the other direction. -26.95% for the US, -33.47% for the EU, and -24.47% in China. Compared to week 8, before the bump, numbers have dropped a lot less over the last two weeks, with -13.52% (US), -17.07% (EU), and -12.75% (CN). But we’ll examine this further for the pre-Forever week in the next breakdown.